

 ETP just launched in Switzerland")


Konstantin Anissimov, Executive Director at CEX.IO, shares his insights about the Bitcoin (BTC) and Ethereum (ETH) November 2020 price movements.
BTC/USDNovember was a key month in Bitcoin’s upside price action this year, seeing BTC/USD near the 20,000 mark. Having opened under the 13,949 resistance level set by the 2019 high, BTC/USD took four days to break it. On 5th November, the pair rose by some 10.2% and above 15,500 in one swing. The rally happened on the back of the news of Joe Biden’s comfortable lead in the US presidential election after the public vote that took place on 4th November. Being a Democratic candidate, Joe Biden was perceived as a proponent of a larger second fiscal aid package for the U.S. economy, and his victory put additional pressure on the US dollar, adding fundamental grounds to the bullish price action of BTC/USD.Until 11th November, BTC/USD spent time trading between 14,500 and 16,000, as the 16,000 level from 2018 was echoing through time. A breakout above 16,000 happened on 12th November and turned 16,000 into support. Then it took three days from 16th to 18th November for BTC/USD to jump to 18,200 – a daily formed during January 2018. The level quickly showed its motive force, instantly sending the pair from 18,405 to 17,300 in less than an hour. But the losses were transitory, and the pair continued sideways between 17,500 and 18,250 until 20th November.Another bullish spike on 20th November took the pair to 18,750 and closer to its historical high at around 19,500. But the pair found resistance at the level and dipped to 17,600 – 17,900 for around four hours on 22nd November. The next spike occurred on 24th November and took the pair from 18,250 to above 19,250. But the pair did not hold the gains long and was driven down to 16,500 in a largely anticipated corrective move on 25th and 26th November.The correction was considered healthy for the continuation of the uptrend, and the double bottom formed on the 4-hour timeframe on 26th and 27th November let BTC/USD break back to above 19,000 in a matter of three days. As a result, the monthly high of 19,882 was achieved on 30th November, leaving the pair within steeping distance of 20,000.
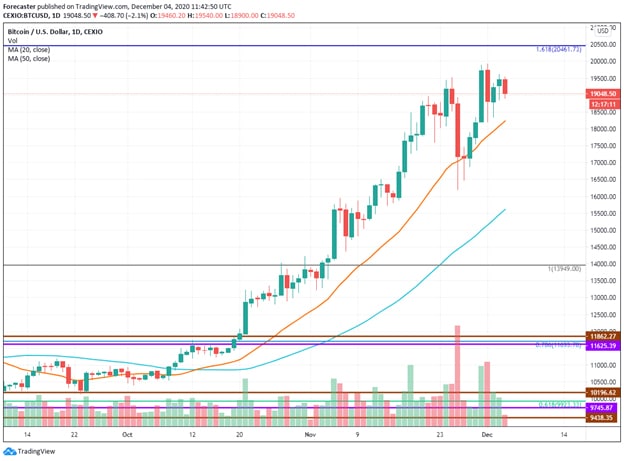

BTC/USD on a daily timeframe chart.
November’s rally in Bitcoin was largely due to the institutional demand from funds and public firms going forward. The Bitcoin held in Grayscale Bitcoin Trust alone has topped 500,000 BTC, with investment funds being the primary investors. Bitcoin continues to be perceived as a good hedge against inflation amid growing inflationary risks in developed economies. On top of that, Bitcoin’s November bullish run was taking place amid gold’s substantial decline, making Bitcoin the most protective hedge assets for many high-net-worth individual and institutional investors.Bearing in mind the still continuing pandemic and the pressure it is putting on economies and fiat money, the market can eligibly expect Bitcoin to be the most lucrative asset for the rest of winter in 2021 with considerable prospects of growth above $20,000 for 1 BTC. The 1.618 Fibonacci level at 20,462 could, however, result in a sizable fall. However, with the current Bitcoin’s stance across financial markets, expecting a long-going decline would be unreasonable. Bitcoin has gained a reputation of a reputable and trustworthy asset among high-net-worth individual investors and public companies, and funds, which now seems to be an intrinsic feature of Bitcoin, which will continue to stimulate demand for Bitcoin regardless of market conditions.ETH/USDEther opened the month of November at the 0.618 Fibonacci level at $389, on 2nd November the ETH/USD pair dipped toward 378 and then to the 50-day simple moving average at 371 on 3rd November. Being backed by both, the pair was able to quickly return under the 0.618 Fibonacci level on 3rd November to start its ascension that would take the pair to 622.85 on 24th November.On 4th November, ETH/USD capitalized above 389; on 6th November, it already closed at 455. Until 19th November, the pair was slowly moving upwards toward the high of 1st September 2020 at 488. The level was tested on 18th November, but the breakthrough was complete on 20th November.From 20th to 24th November, the Ether crossed the distance of $135.4 from $473.6 to $611. The gains were largely retraced in a downside corrective move on 25th and 26th November against the backdrop of BTC/USD correction during those days. ETH/USD was momentarily at 480 on 26th November but closed the day at 519.2 well above the 488 support level. As Bitcoin was able to reverse the downside trading course, Ether followed in its footsteps and got back above $600 on 30th November, closing the month at $615.
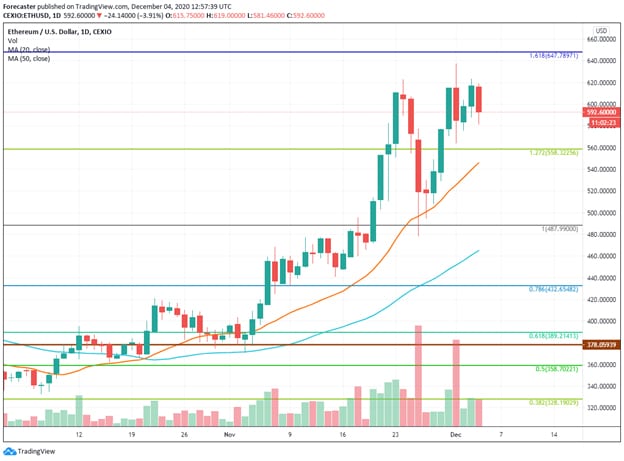

ETH/USD on a daily timeframe chart.
Etherum has finally taken its own share of gains after a mundane October, during which it showed little market positivity to hearten the Ethereum community. A good portion of the rally took place in the run-up to the genesis phase launch, which was the first phase in the launch of the Ethereum 2.0 mainnet. The launch of genesis phase required 16,384 validators and 524,288 ETH in the Ethereum 2.0 deposit contract, which was reached on 24th November along with Ether’s rally worth $47.7 or 8.47%.The highly anticipated Ethereum 2.0 launch has finally played its positive role for Ethereum’s market position and will likely continue to provide some buying stimulus for Ether in the future, as the beacon chain is expected to double Ethereum’s throughput and decrease its network congestion.Considering that ETH/USD is not even halfway to its current all-time-high, it could be reasonable to expect the smart-contract leader to continue its bullish move. However, one should be cautious investing in Ethereum, since it has not been enjoying the institutional demand that has been in place for Bitcoin in 2020 and is more subject to market manipulations.
next Share:
.ml-error input {
background: url(https://bucket.mlcdn.com/images/default/error-icon.png) 98% center no-repeat #ffffff !important;
background-size: 24px 24px !important;
}
.ml-subscribe-close {
width: 30px;
height: 30px;
background: url(https://bucket.mlcdn.com/images/default/modal_close.png) no-repeat;
background-size: 30px;
cursor: pointer;
margin-top: -10px;
margin-right: -10px;
position: absolute;
top: 0;
right: 0;
}


 Tops 3rd Place Hitting $270 According to Coinmarketcap")
