Litecoin, the 5th altcoin based on the total market cap, has been quiet recently in terms of new updates and partnerships. Litecoin brands themselves as the Silver of the crypto-assets, whereas Bitcoin is Gold.
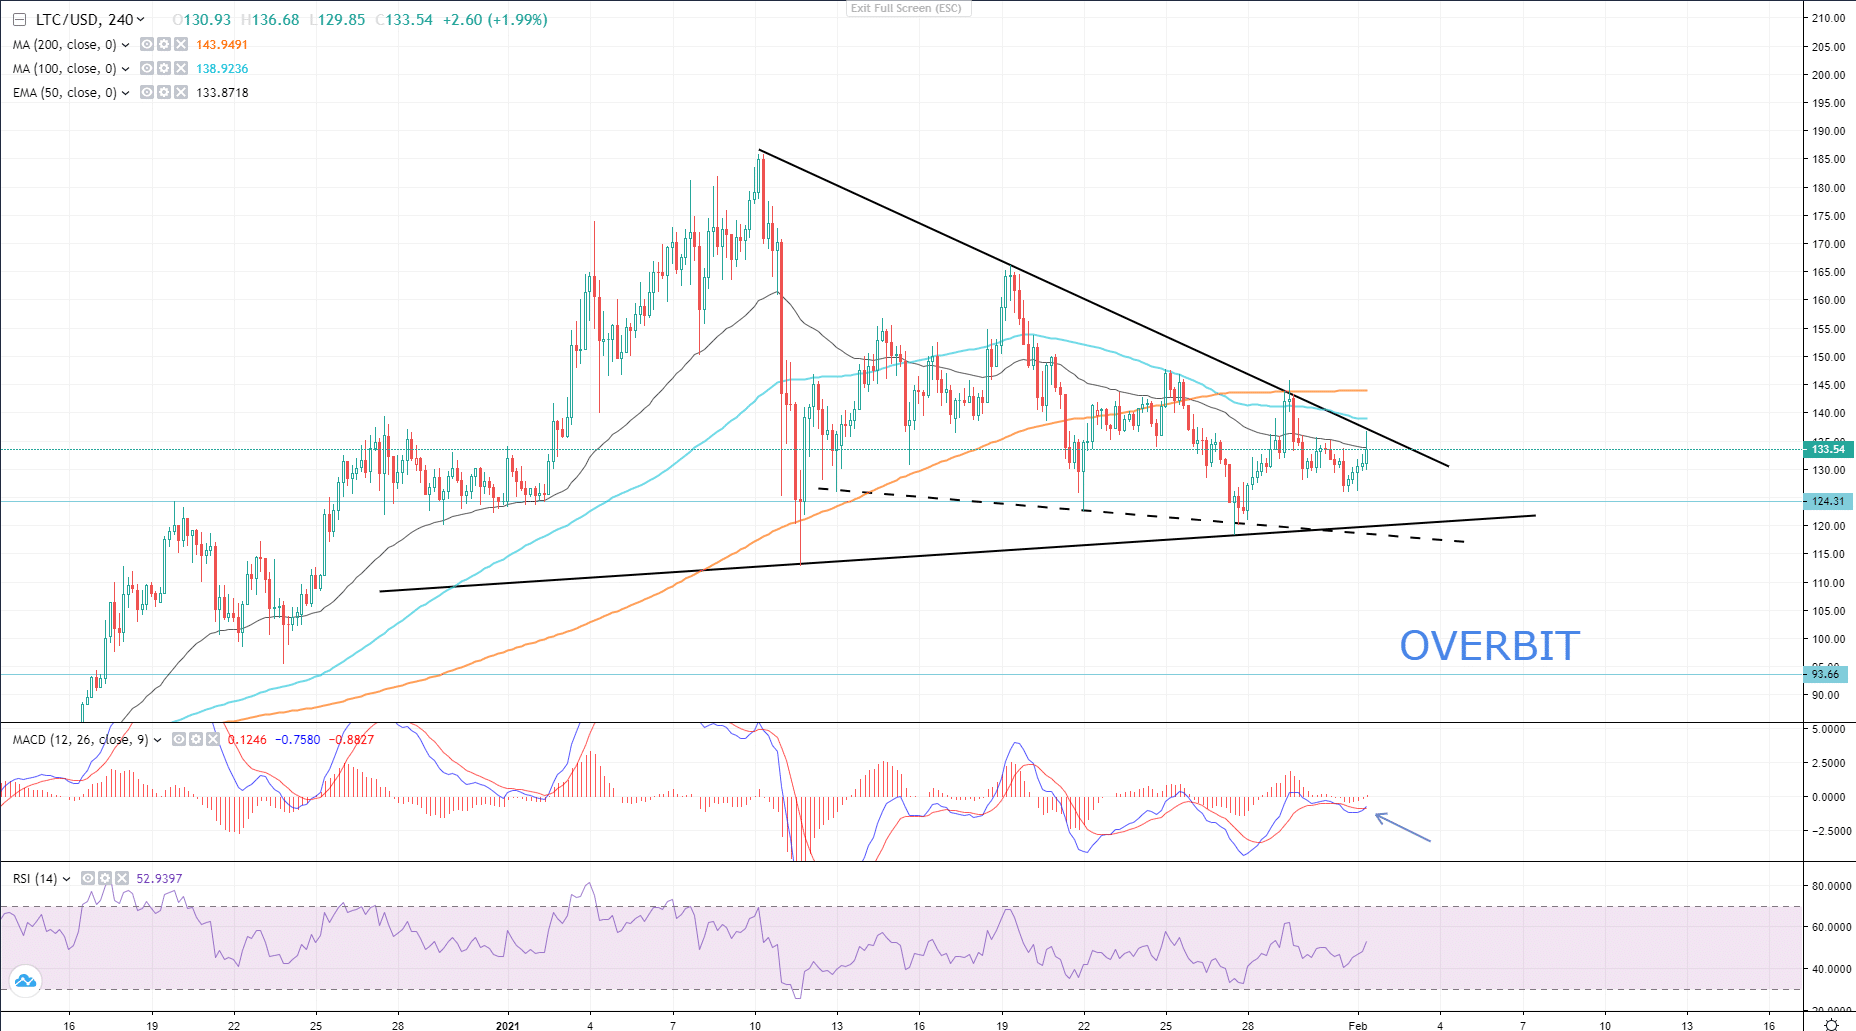
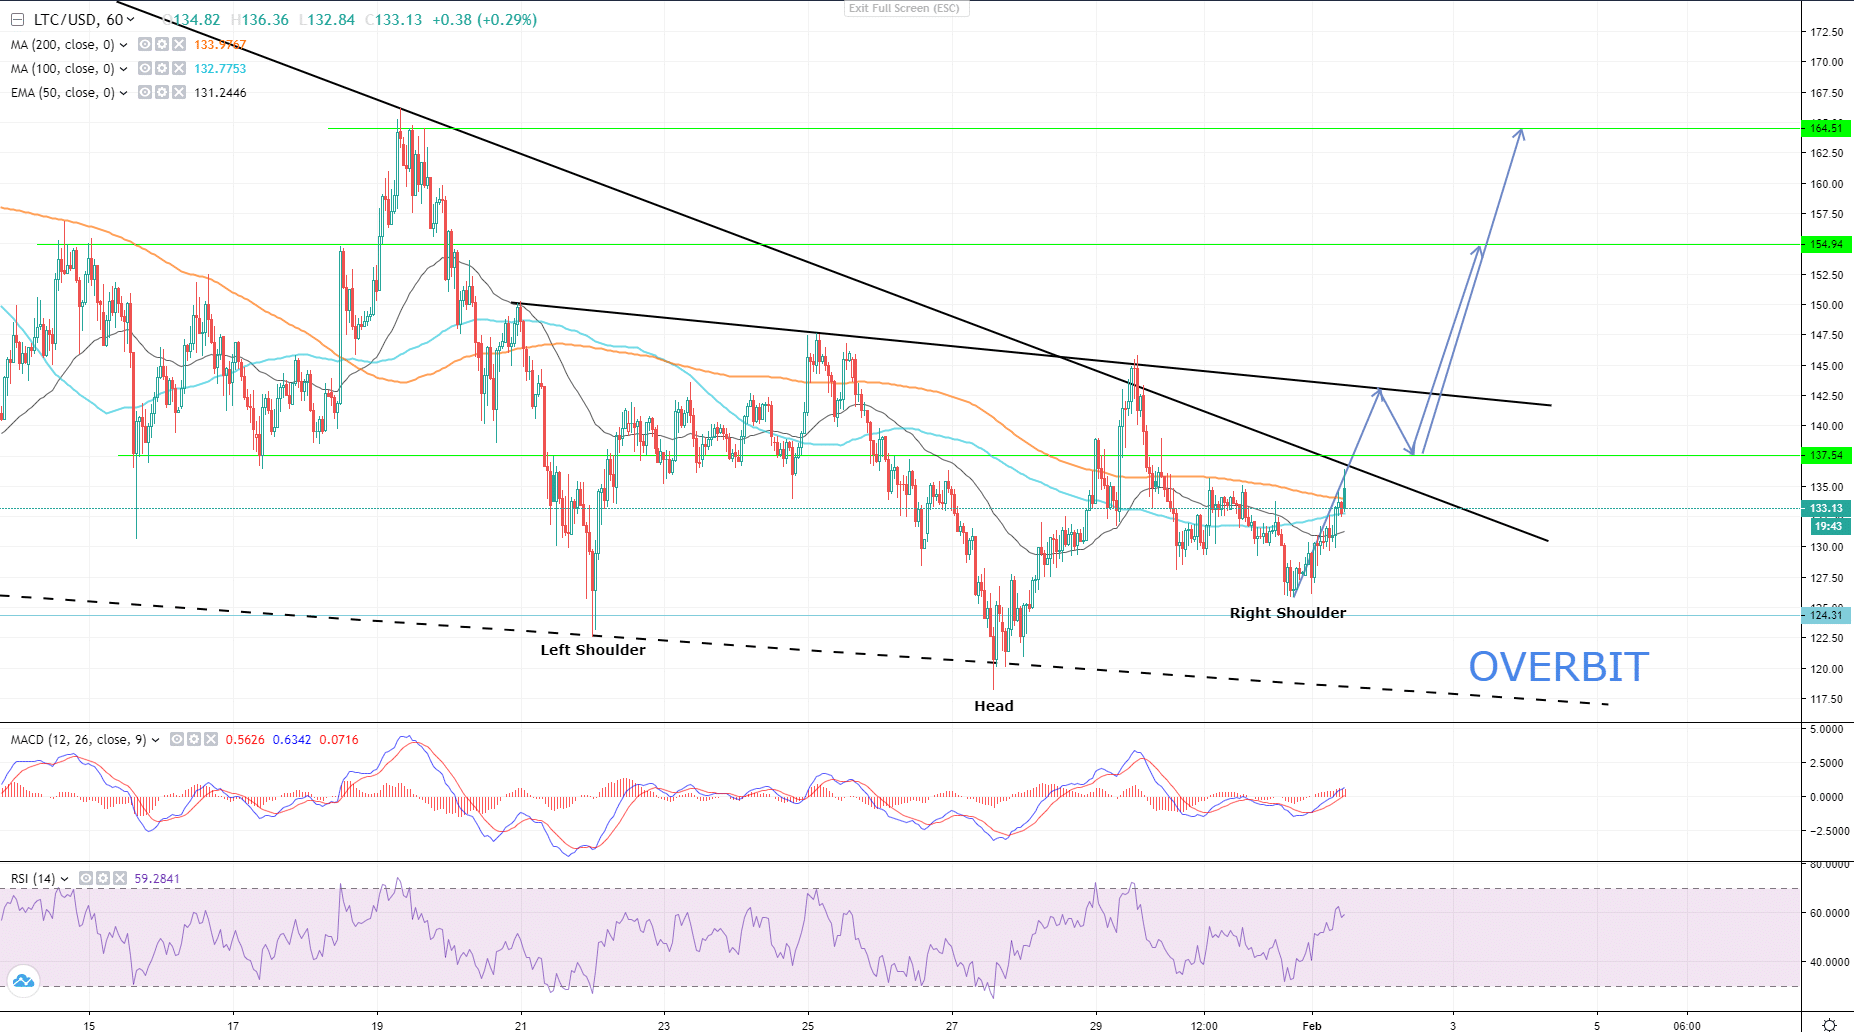
Litecoins price action for the past quarter, since the October’s MimbleWhimble update. The price is strictly bound to the crypto-market’s sentiment and Bitcoin’s price action. By the time of writing of this article, LTC/USD is traded at $133.50 and is currently traded below the moving averages MA100 and MA200 on a 4H chart. Litecoin price on OverbitThere is a strong dynamic resistance which restrains Litecoin to continue the bullish uptrend. However according to the Elliott Waves principle, Litecoin should break the resistance and continue upwards as its now completing the Wave E of the 5-wave corrective wave structure. If the pair fails to break the upper edge of the triangle, LTC will drop to seek support at levels near $120 – 118, where there is a strong static and dynamic support, which will signal another rather stronger uptrend impulse. MACD and RSI indicators signal the uptrend continuation, though one should wait for a breakout to firm the uptrend continuation.An hourly chart of LTC/USD looks more optimistic as there is a possible Inverted Head and Shoulders formation.
 Litecoin price on OverbitThe pattern suggests that after a breakout from the dynamic resistance described below, the bull run of the uptrend might be withheld for a short time by the short-term dynamic resistance of January 21, which is also the Neckline of the Head and Shoulders pattern. The path on the chart is theoretical and describes only my vision based on support and resistance levels and the price action theories. If The pattern is complete and Litecoin breaks $144, it will continue the uptrend up to $154.50 and above that to $164.50.


