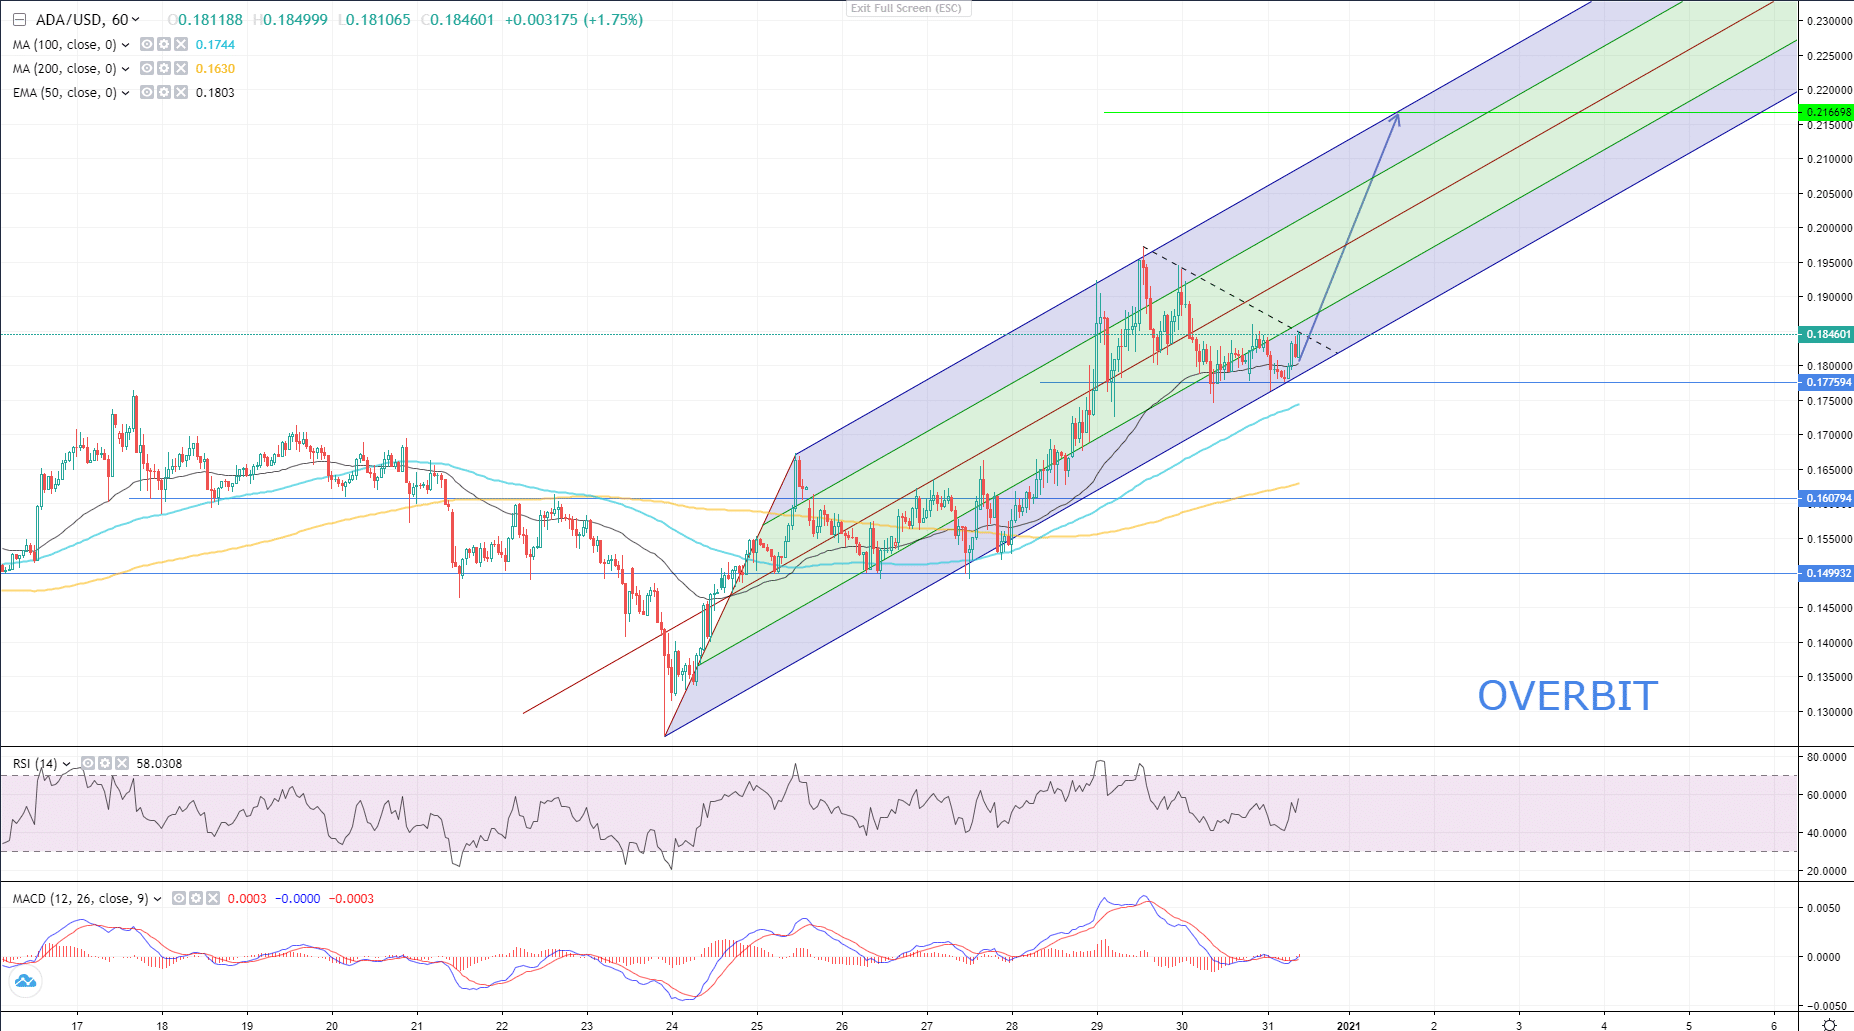
Since December 23 this year, Cardano was moving upwards with a high pace breaking out from resistances up ahead and here it is at this year’s high at $0.197110.
There were significant updates in the network, mainly for its transition to DeFi with the Shelley update. ADA against the US Dollar was gaining since March 13 as all markets were down due to the Covid-19 virus spread. As the US Dollar was weakening, ADA shifted to an uptrend.The pair is following the path traced by the ascending channel and is heading towards levels near $0.216698. The last impulse on the hourly chart of ADA/USD has tested the dynamic resistance of December 29 and is about to break free from this barrier. ADA/USD quote on OverbitAs seen on the chart above, the pair today tested the dynamic resistance, the lower edge of the ascending channel and reversed. This price action does signal another bullish run towards the next test of the upper band of the channel.The confirmation of the breakout is also described on an hourly chart of ADA/USD below. As seen on the chart, the pair has made a breakout from the triangle, however is still below the short-term dynamic resistance. As a rule of a triangle pattern, the next target after the breakout would be at the same distance from the beginning of the impulse up to the highest point of the motive wave. However I highly recommend to take into account previous static resistances and other dynamic resistances. The distance from the motive wave of December 27 up to the highest level on the chart and the first major short-term correction of December 29 up to $0.216698 are the same.
 ADA/USD quote on OverbitThe best scenario for ADA/USD is a breakout from the short-term dynamic resistance, retest it as a support and climb towards the retest of the upper band of the ascending channel. If the pair fails we may witness a drop to $0.180590 to test the dynamic resistance and the $0.177594 support below that level.


